
International Tourism within Australia

Statistics often seem complex and difficult to comprehend, especially for younger audiences. This project aims to transform numerical data of Australian tourism into engaging and visually appealing visualisations. By adopting this innovative and tangible approach, the project highlights the importance of making datasets more accessible and enjoyable to explore.
The context would be either at a school educational event or public exhibition about tourism for school children. This could take place at larger venues, such as the State Library of Queensland, Museum of Brisbane or local libraries.
Project
Year
2024
The Challenge
The brief requires creating a portfolio of information designs about a topic of my choice.
The goal is to experiment with new data visualisation methods, moving beyond traditional static 2D screens. In the end, the outcomes can be either a physical or an interactive design, showcasing innovative ways to present your data.
I decided to go forward with the physical option to take on the data - form challenge. This means that the tangible object has to aligns meaningfully with the data, evoking it directly.
Audience
The audience of the visualisations is elementary students. Playful colors and typeface were chosen to captivate this younger audience. The data takes a short amount of time to comprehend, interpret and analyse, therefore it intrigues and encourages students to learn more about travel and tourism in general and international market performance in specific.

Rationale
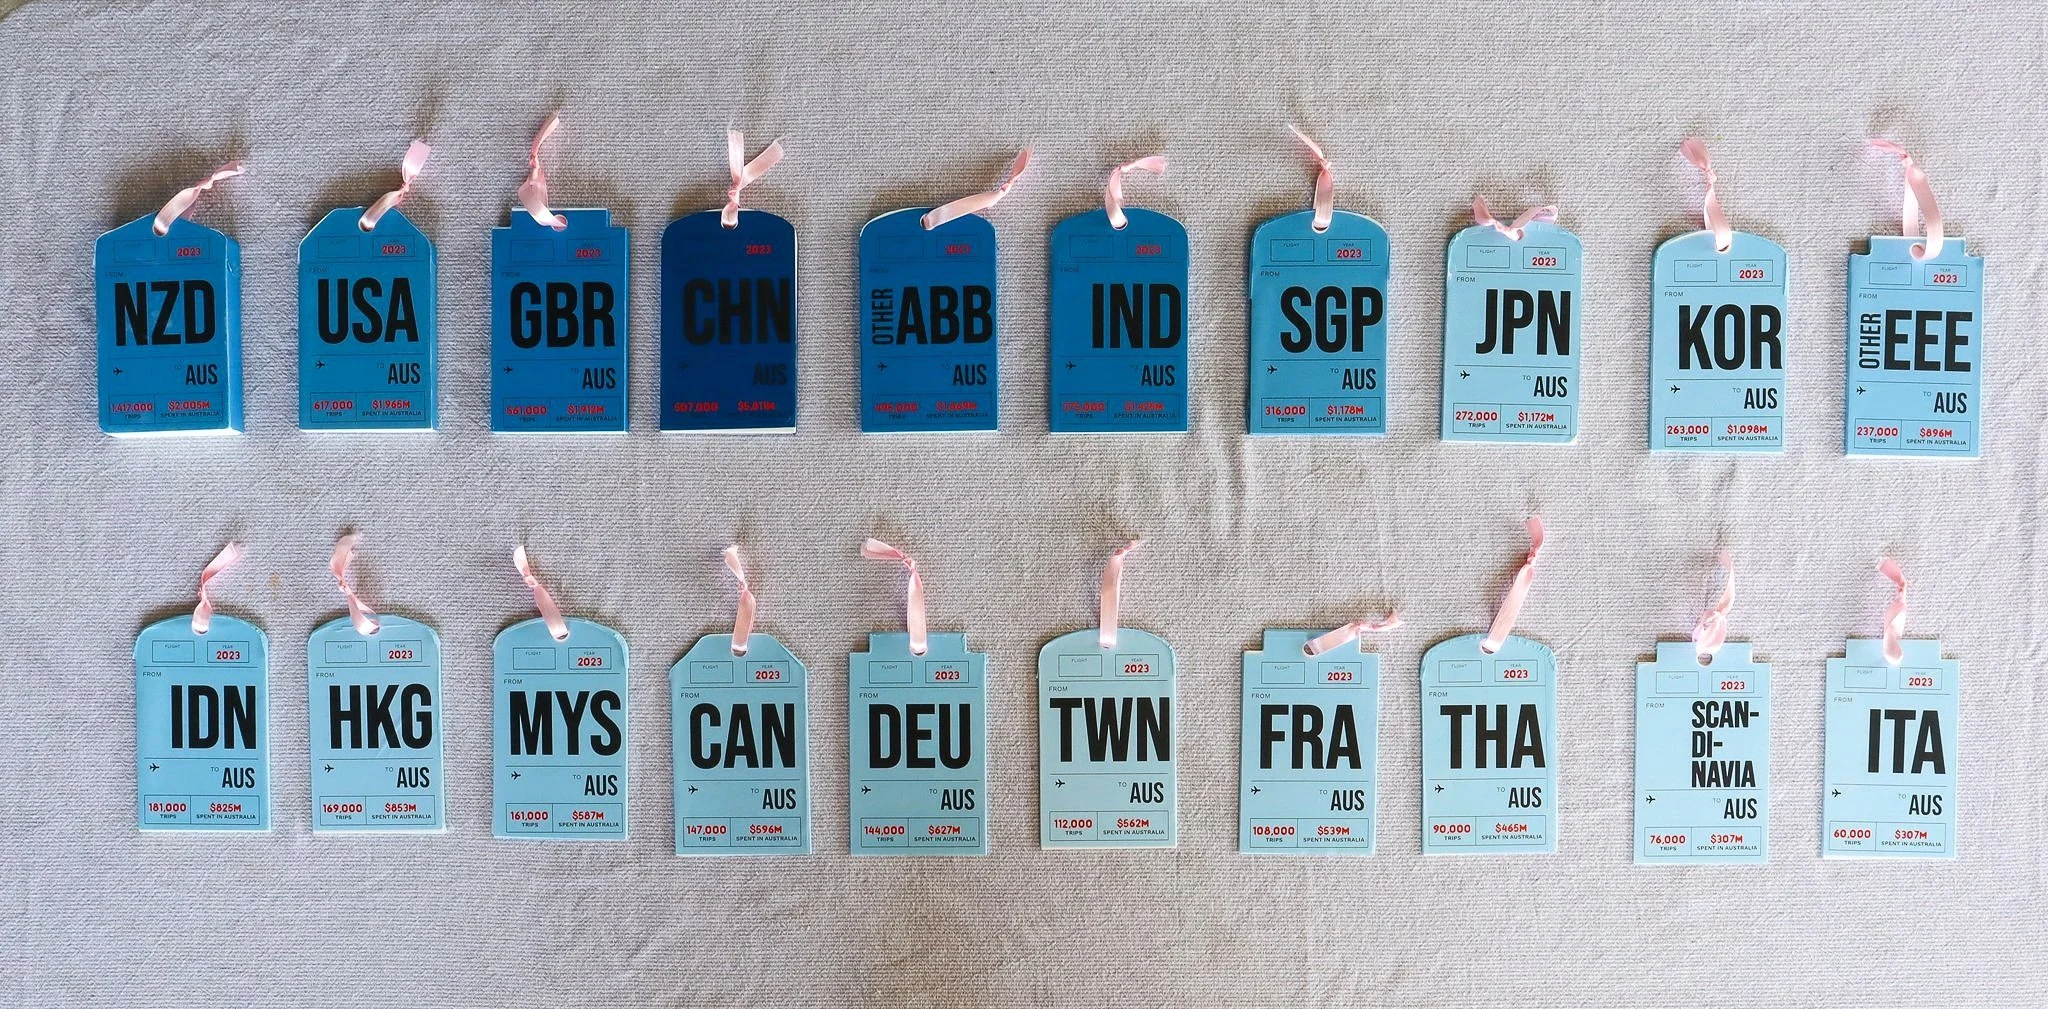
The luggage tags idea draws close connection to the notion of travelling and going holidays. Some people keep their checked luggage tags as souvenirs to cherish the destinations they have been to.
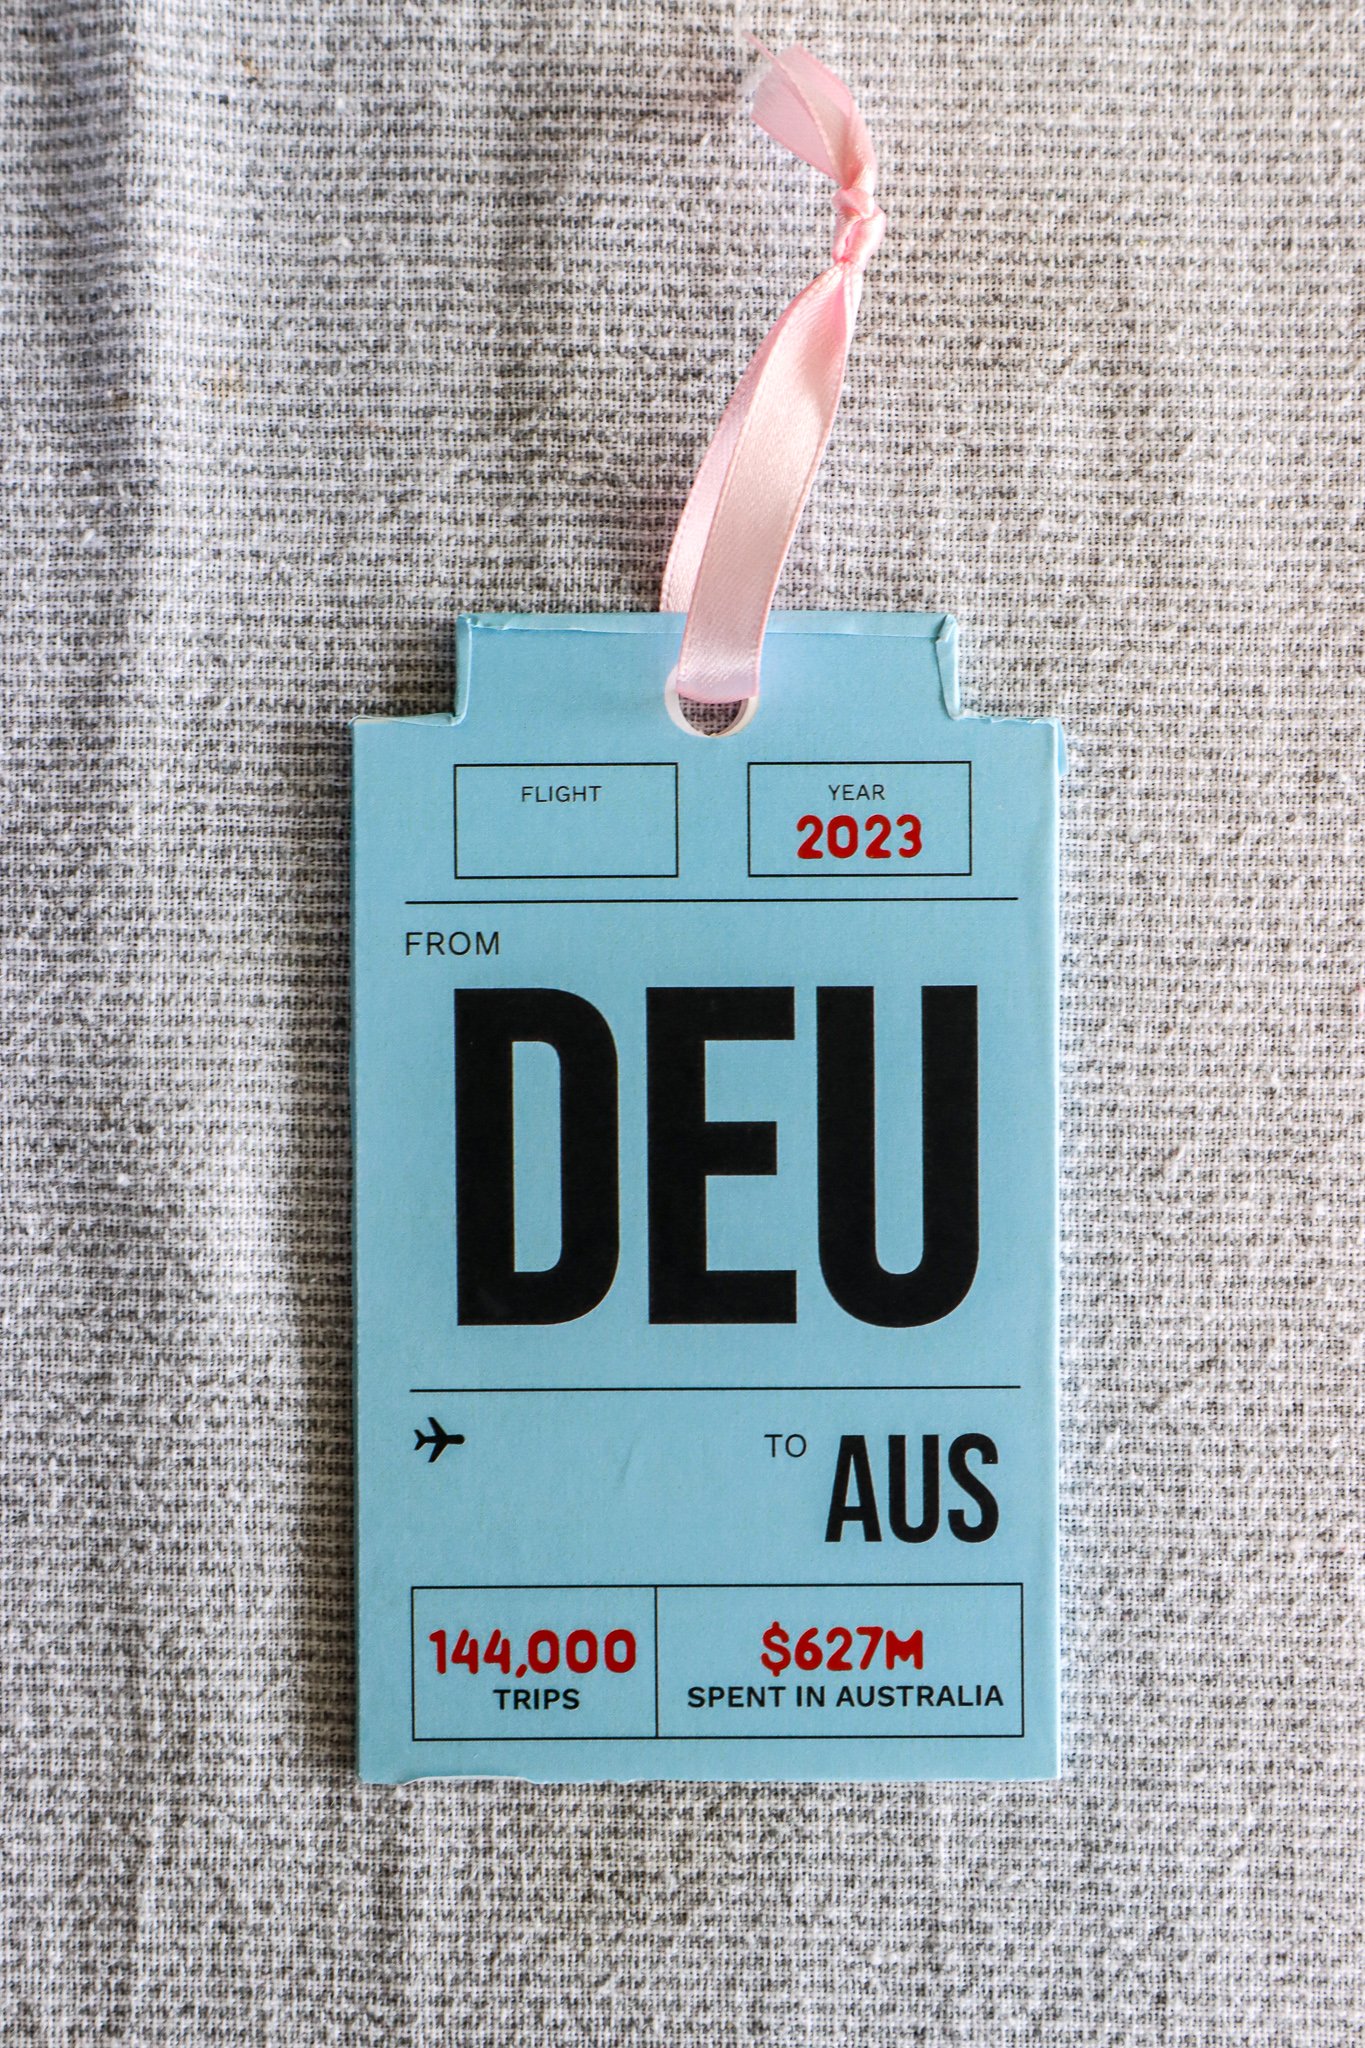
Each tag varying in thickness, shape, and color to represent distinct aspects: the number of trips departed from each country, the country region, and the total spending in Australia.
Thickness: The thicker the tag, the higher the number of trips made from that country to Australia.
Color: The darker the shade, the greater the amount spent by that country in Australia.
Shape: Four different shapes are used to indicate regions: Asia, Europe, Oceania, and North America.
The Process (Physical Visualisation)
-
The Paper Exploration
I started to explore different features when folding up papers to make a luggage tag.
I realised that working with thickness is a bit abstract unless going forward with 3d printing.

-
PACT + SCAMPR Analysis
This step is essential to consider the topic “travelling” from different perspectives. Looking at the term from a variety of contexts makes me realise that there are lots of interesting points to consider. Some of the notable insights are:
Some people treat stamps on the passport as some sorts of souvenirs/ collections
Some people view travelling as the way to come back from they are from, whereas the others travel for leisure purposes.

-
Further Thinking
The next step is to consider the data mapping. After carefully consider different features of the luggage tag, I decided to move forward with this:
Thickness of the tags: number of trips made by each country of residence
Shape of tags: the region of each country
Color/ shades of tags: the amount of money that the country spent on Australia

-
Design Iteration
I started by calculating the thickness of each country tag based on the collected data that has been cleaned and manipulated in Excel.
After that, I designed one tag for each region with varied thicknesses in Fusion 360, then proceeded with lots of 3D printing tests.

-
Outer Cover Design
I started to design the outer cover of the tag so that I could print them out as sticker and stick them on the tags. This is because the printers/ laser cutter unfortunately cannot print in customised colours.

-
Prototyping
After receiving the tags from the lab, I categorised them into different regions and sorted them from thickest to thinnest. This made it easier to identify which one is which.


Digital Visualisation
International travel estimates by main reason of visit

Tourism appears to be recovering from the impact of COVID-19, gradually returning to pre- pandemic levels. There is a drastic difference in the number of trips before and after 2019, with a slow but steady growth as seen from 2022 to 2023 as the industry recovers. Despite these fluctuations, holiday travel has consistently remained the most popular reason for visiting Australia throughout the five-year period.
Source: https://www.tra.gov.au/en/international/ international-tourism-results https://www.tra.gov.au/en/about-tra/services